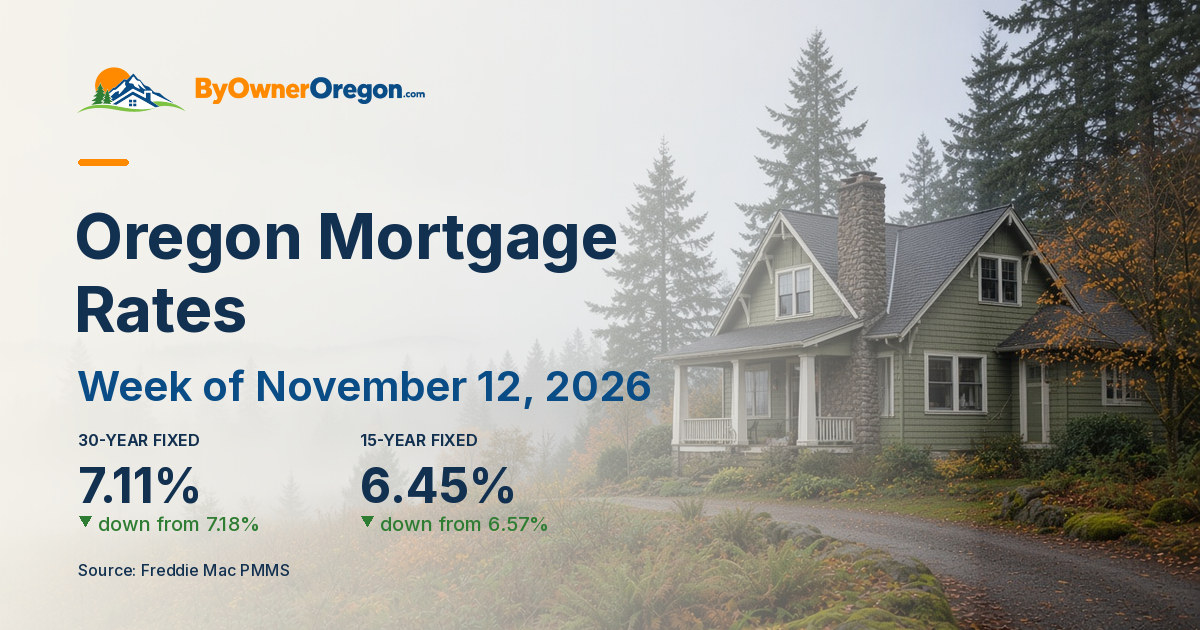
As of November 2026, U.S. home sales are running at their slowest pace in 16 years: NAR reported October existing-home sales at a seasonally adjusted annual rate of 3.75 million, down 8.8% from a year earlier and the lowest level since August 2010 [1]. Prices have not cracked, though. The national median was $416,700, up 0.4%, while Freddie Mac's 30-year fixed rate eased to 7.11% on November 12 and builder confidence fell to a 14-year low on November 17 [1][2][3].
If you own a home in Portland, Salem, Eugene, Bend, or Medford, those headlines are not just national noise. The same rates, the same cautious buyers, and the same competition from builders cutting prices are showing up in Oregon's own October numbers. This post explains what the latest national reports actually say, how they line up with Oregon data from RMLS, and what Oregon sellers and buyers can do about it before the holidays.
Data as of November 17, 2026. Figures cover NAR's October 2026 existing-home sales (released November 12), Freddie Mac's November 12 weekly rate survey, the NAHB/Wells Fargo builder index for November (released November 17), Census/HUD September 2026 new-home sales and construction, the Federal Reserve's October 28 statement, BLS October 2026 consumer prices, Realtor.com October 2026 listing data, and RMLS October 2026 reports for the Portland metro and Lane County, as noted for each source.
Why Did U.S. Home Sales Fall to a 16-Year Low?
The short answer is mortgage rates. NAR's October report showed existing-home sales falling 5.5% from September to a 3.75 million annual pace, with sales down from a year earlier in all four regions [1]. NAR Chief Economist Lawrence Yun tied the slump directly to borrowing costs, saying mortgage rates "have climbed to their highest levels since 2000, aside from a single month in 2023. As a result, home sales fell to their lowest level since August 2010" [1].
NAR's release noted that the 30-year fixed rate averaged 7.33% in October, according to Freddie Mac, up from 6.86% in September and 6.25% a year earlier [1]. That jump hit buyers fast. NAR's Housing Affordability Index registered 100.7 in October, down from 107.3 a year earlier, and affordability declined in every region [1].
The buyer mix shifted too. First-time buyers made up 29% of October sales, down from 32% a year earlier, while cash sales held at 29% and investors and second-home buyers rose to 20% from 16% [1]. In plain terms, buyers who need a mortgage are the ones stepping back, while buyers with cash or equity are still active.
Are Home Prices Falling Nationally?
Not on closed sales. The national median existing-home price was $416,700 in October, up 0.4% from $414,900 a year earlier, which NAR called the 40th consecutive month of year-over-year gains [1]. Distressed sales were just 2% of transactions [1]. Most owners are not forced to sell, so fewer sales are happening instead of steep price drops.
How Did the West and Oregon Compare in October?
The West was the weakest region in the country. NAR reported Western sales at an annual rate of 650,000 in October, down 9.7% from September and 14.5% from October 2025, the largest year-over-year decline of any region. The Western median price was $624,300, unchanged from a year earlier [1].
Oregon's October numbers tell a similar story. In the Portland metro, which covers Multnomah, Washington, and Clackamas counties and nearby areas, RMLS reported 1,587 pending sales in October, down 20.2% from a year earlier, and 1,622 closed sales, down 21.5%. Inventory rose to 4.3 months and total market time was 67 days. The median sale price was $545,000, up 0.9% from $540,000 in October 2025 [10].
In Lane County, RMLS reported pending sales down 22.0% and closed sales down 23.1% from a year earlier, while new listings rose 9.7%. Inventory rose to 3.8 months, market time was 64 days, and the median sale price was $439,000, down 2.0% from $448,000 [11]. Realtor.com's October metro table showed Portland-Vancouver-Hillsboro active listings up 9.6% from a year earlier, a median list price of $580,000 (down 3.2%), and about 30.6% of listings with a price cut, one of the higher shares among large metros [9].
So the pattern in Oregon matches the national one: far fewer deals, more homes to choose from, and prices that are roughly flat rather than falling sharply.
Where Are Mortgage Rates Headed After the Fed's October Hold?
Rates have eased for a month but are still well above last year. Freddie Mac's Primary Mortgage Market Survey showed the 30-year fixed averaging 7.11% as of November 12, 2026, down from 7.18% the week before and the fourth straight weekly decline, but up from 6.24% a year earlier. The 15-year fixed averaged 6.45% [2]. Freddie Mac publishes a new reading every Thursday.
The Federal Reserve held its target range for the federal funds rate at 3.75% to 4.00% on October 28, 2026, in a 10–2 vote. The statement said "inflation remains elevated," and the two dissenters, Lisa D. Cook and Beth M. Hammack, preferred a quarter-point increase [6]. The next Fed meeting is scheduled for December 8–9 [6].
Inflation data has not helped. The Bureau of Labor Statistics reported the Consumer Price Index rose 0.4% in October after a 0.6% rise in September, with shelter up 0.3% [7]. BLS noted it could not publish most 12-month changes for October because October 2025 data were never collected during the lapse in appropriations [7]. After that report, Realtor.com's economists wrote that a December Fed hike "is now essentially priced in" and warned that the recent rate dip could reverse as the 10-year Treasury yield moved back toward 5% [8].
What Does 7.11% Mean in Dollars?
Using our own rounded math, principal and interest on a $400,000 30-year loan is about $2,691 a month at 7.11%, compared with about $2,460 at 6.24% a year ago. That is roughly $231 more a month, or about $2,770 a year, for the same loan [2]. For an Oregon buyer stretching to afford a Portland-area home near the $545,000 median, that gap can decide whether an offer gets written at all.
Why Are Home Builders Cutting Prices?
Builders are feeling the same pressure. The NAHB/Wells Fargo Housing Market Index fell four points to 25 in November, its lowest reading since April 2012. Current sales conditions fell to 28, sales expectations to 30, and prospective-buyer traffic to 16, its lowest level in 15 years outside the start of the pandemic [3]. NAHB Chief Economist Robert Dietz said "mortgage rates above 7%, softer consumer confidence and an uncertain economic outlook are holding buyers back" [3].
To keep sales moving, 46% of builders cut prices in November, the highest share since Covid, with an average cut of 6%. 68% offered sales incentives, also a post-Covid high [3]. On a three-month average, the West scored 23, the lowest of the four regions [3].
The latest federal new-home data shows why that matters for resale sellers. Census and HUD reported September new-home sales at a 676,000 annual pace, down 5.3% from a year earlier, with 8.4 months of supply and a median new-home price of $400,400, down 3.9% [4]. That median sat below NAR's October existing-home median of $416,700 [1][4]. Construction is also pulling back: September housing starts ran at 1,221,000, down 7.4% from a year earlier [5]. In growing areas such as Bend and Deschutes County, Salem and Marion County, or the Medford area of Jackson County, a nearby new-construction community offering a rate buydown or a price cut can be your toughest competition.
What Does This Mean for Oregon Home Sellers This Winter?
Price for today's buyer pool. Fewer buyers are shopping, and the ones who remain are comparing your home with price-cut listings and builder incentives. Start from recent closed sales in your neighborhood, not last spring's list prices. Our guide to pricing your Oregon home right walks through the process.
Plan for negotiation. With nearly half of builders cutting prices and about three in ten Portland-area listings taking a price cut [3][9], buyers expect to ask for something. Decide ahead of time whether you would offer a repair credit or help with a rate buydown. Our post on seller concessions and rate buydowns explains how those work in Oregon.
Give yourself a realistic timeline. Portland-area homes averaged 67 days of market time in October and Lane County homes 64 days [10][11]. If you also need to buy, build in slack. Our winter selling guide covers how to show well in the rainy months.
Keep more of your equity. When prices are flat, your cost to sell comes straight out of your proceeds. On the Portland metro's October median of $545,000, a traditional 3% listing commission would be about $16,350. A Flat Fee MLS listing at $199 to $1,099 would save roughly $15,251 to $16,151 of that listing-side cost. On Lane County's $439,000 median, 3% is about $13,170. Even our top Discount Full Service tier ($999 + 0.5%) would cost about $3,724 on a $545,000 sale. Run your own numbers with our savings calculator.
Understand how buyer's agent pay works now. Under today's rules, a buyer's agent is paid under the buyer's written agreement with that agent, and any request for the seller to contribute comes in the buyer's offer, where you can negotiate it. It is not offered through the MLS. Our post on buyer's agent commission changes in Oregon has the details.
What Does This Mean for Oregon Buyers?
You have more leverage than a year ago. National inventory reached 1.59 million homes, or 5.1 months of supply, up from 4.4 months a year earlier [1]. In Portland and Lane County, pending sales are down more than 20% [10][11]. You may not need to waive inspection or financing contingencies to compete.
Shop builders and resale side by side. With 68% of builders offering incentives [3], compare a builder's total package, including any rate buydown, against resale homes that have sat on the market.
Rate-proof your budget. Rates are nearly a full point higher than a year ago even after four weekly declines, and the Fed meets again December 8–9 [2][6]. Get pre-approved and leave room in case rates move up again.
Get help with the contract. If you want professional help with the offer, negotiation, and deadlines, our flat-fee buyer representation service puts a Realty Net, LLC buyer's agent on your side for a fixed dollar fee instead of a percentage.
What Reports Should Oregon Sellers Watch Next?
Several reports land before year-end. NAR's October pending home sales index is scheduled for November 18, and November existing-home sales for December 9 [12]. The Census Bureau's October new residential construction report is due November 18 and October new-home sales November 25 [13]. Freddie Mac's next weekly rate survey is November 19, and the Fed's December 8–9 decision will set the tone for rates into early 2027 [2][6]. Watch pending sales most closely, because contracts signed now become the closed sales reported next month.
How By Owner Oregon Can Help
By Owner Oregon is an advertising platform for Oregon home sellers, and Realty Net, LLC is the licensed brokerage behind every listing. Together they have helped Oregon homeowners sell since 2001, with 4,700+ homes sold. In a slow market, the right level of help keeps more money in your pocket:
- Flat Fee MLS ($199–$1,099): your home goes on the MLS that serves your area while you handle showings and offers.
- Agent Assist ($499–$1,099, plus $700 at closing): add licensed broker coaching on pricing, offers, and negotiation.
- Discount Full Service: $299 + 1%, $599 + 0.75%, or $999 + 0.5% for full broker representation.
There is no compliance fee at closing on any package. SellerHQ™ with BuyerLink™ is built into every By Owner Oregon package, so you can manage showings, offers, and buyer inquiries in one place. Compare packages and pricing to see which fits your sale.
Frequently Asked Questions
Why are U.S. home sales so low in November 2026?
NAR reported October 2026 existing-home sales at a 3.75 million annual pace, the lowest since August 2010. NAR's chief economist pointed to mortgage rates, which averaged 7.33% in October according to Freddie Mac. Higher payments pushed many mortgage buyers out, while first-time buyers fell to 29% of sales.
Are home prices dropping in Oregon?
Not much on closed sales. RMLS reported the Portland metro's October 2026 median at $545,000, up 0.9% from a year earlier, while Lane County's median was $439,000, down 2.0%. Price cuts are common, though: Realtor.com showed about 30.6% of Portland-area listings with a price reduction in October.
What are mortgage rates right now?
Freddie Mac reported the average 30-year fixed rate at 7.11% as of November 12, 2026, down for a fourth straight week but up from 6.24% a year earlier. The 15-year fixed averaged 6.45%. Your own rate depends on credit, down payment, loan type, and points, so compare several lenders.
Will the Fed raise rates in December 2026?
No one knows yet. The Fed held at 3.75% to 4.00% on October 28, with two members preferring a hike. After a hotter October inflation report, Realtor.com economists said a December hike looked priced in. The Fed meets December 8–9, and mortgage rates often move ahead of that decision.
Should I sell my Oregon home now or wait for spring 2027?
It depends on your timeline. Waiting does not guarantee lower rates, and builders are already cutting prices. If you sell now, price from recent local sales, expect negotiation, and allow about two months on market based on October RMLS data. Compare your net proceeds before deciding.
How do new-home builder discounts affect Oregon resale sellers?
NAHB says 46% of builders cut prices in November and 68% offered incentives. If a new community near your home offers a rate buydown or price cut, buyers will compare. Respond with sharp pricing, good condition, and a clear plan for concessions you would accept.
Market data changes quickly. The figures above come from the sources below for the periods shown, and the payment and savings examples are rounded illustrations, not loan quotes or valuations. This article is general information about the housing market, not financial, legal, or tax advice.
Sources
- National Association of REALTORS®, "Existing-Home Sales Decreased 5.5% in October, According to NAR Report," November 12, 2026 (October 2026 data): nar.realtor
- Freddie Mac, Primary Mortgage Market Survey, rates as of November 12, 2026: freddiemac.com/pmms
- National Association of Home Builders, "Builder Sentiment Continues to Fall on Affordability Concerns," November 17, 2026 (November 2026 NAHB/Wells Fargo HMI): nahb.org
- U.S. Census Bureau and U.S. Department of Housing and Urban Development, "Monthly New Residential Sales, September 2026," October 27, 2026: census.gov
- U.S. Census Bureau and U.S. Department of Housing and Urban Development, "Monthly New Residential Construction, September 2026," October 20, 2026: census.gov
- Board of Governors of the Federal Reserve System, "Federal Reserve issues FOMC statement," October 28, 2026, and 2026 FOMC meeting calendar: federalreserve.gov, FOMC calendar
- U.S. Bureau of Labor Statistics, "Consumer Price Index — October 2026," November 10, 2026: bls.gov
- Realtor.com Economic Research, "Freddie Mac rates dip again this week, but sticky inflation could erase the relief," November 12, 2026: realtor.com
- Realtor.com Economic Research, "October 2026 Housing Report," November 4, 2026 (October 2026 data): realtor.com
- RMLS, Market Action Report, Portland Metro, October 2026 reporting period: rmlsweb.com
- RMLS, Market Action Report, Lane County, October 2026 reporting period: rmlsweb.com
- National Association of REALTORS®, 2026 Statistical News Release Schedule: nar.realtor
- U.S. Census Bureau, Survey of Construction release schedule: census.gov